Spirit in the Air: Can Art Change the Climate?

Exhibition detail with live CO2 feedback from the Edinburgh Festival streets and Venues. (2013, Collins & Goto Studio)
2013 at the Tent Gallery at Edinburgh College of Art, Presented during the Edinburgh Festival. Funded by Creative Carbon Scotland; here is their live project website,
CO2 Edenburgh: Can Art Change the Climate?
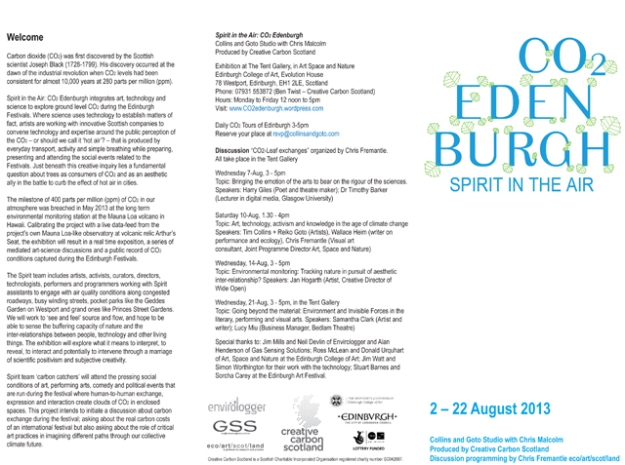
CO2 Edenburgh was a strategic collaboration between artists Tim Collins and Reiko Goto with Creative Carbon Scotland, Chris Malcolm, ecoartscotland and Art Space Nature exploring the impacts of Edinburgh’s Festivals on climate change.
Spirit in the Air – an exhibition that used ground-breaking technology supplied by Gas Sensing Solutions and Envirologger to measure real-time carbon dioxide (CO2) levels when Edinburgh is packed to bursting with artistic activity and people. Throughout the month of August ‘Carbon Catchers’ roamed the streets and parks of Edinburgh to seek out CO2 hotspots allowing the artists to make the invisible comprehensible through visual and sound works in the gallery.
In keeping with EAF’s 2013 programme theme Parley CO2 Edenburgh hosted a series of free discussions throughout the festival curated by ecoartscotland. To find out more click here.
Carbon dioxide (CO2) was first discovered by the Scottish scientist Joseph Black (1728-1799). His discovery occurred at the dawn of the industrial revolution when CO2 levels had been consistent for almost 10,000 years at 280 parts per million (ppm).
Spirit in the Air: CO2 Edenburgh integrated art, technology and science to explore ground level CO2 during the Edinburgh Festivals. Where science uses technology to set up matters of fact, artists worked with innovative Scottish companies to convene technology and expertise around the public perception of the CO2—(or should we call it ‘hot air’?)—that is produced by everyday transport, activity and simple breathing while preparing, presenting and attending the social events related to the Festivals. Just beneath this creative inquiry was a fundamental question about trees as consumers of CO2 and as an aesthetic ally in the battle to curb the effect of hot air in cities.
The milestone of 400 parts per million (ppm) of CO2 in our atmosphere was breached in May 2013 at the long-term environmental monitoring station at the Mauna Loa volcano in Hawaii. Calibrating the project with a live data-feed from the project’s own Mauna Loa-like observatory at volcanic relic Arthur’s Seat, the exhibition will result in a real-time exposition, a series of mediated art-science discussions and a public record of CO2 conditions captured during the Edinburgh Festivals.
The Spirit team included artists, activists, curators, directors, technologists, performers and programmers working with Spirit assistants to engage with air quality conditions along congested roadways, busy winding streets, pocket parks like the Geddes Garden on Westport and grand ones like Princes Street Gardens. They worked to ‘see and feel’ source and flow, and hope to be able to sense the buffering capacity of nature and the inter-relationships between people, technology and other living things. The exhibition will explore what it means to interpret, to reveal, to interact and potentially to intervene through a marriage of scientific positivism and subjective creativity.

Exhibition details and an overview of two of the four seminars organized by Chris Fremantle. (2013, Collins & Goto Studio.)
Spirit team ‘carbon catchers’ attended a range of art, performing arts, comedy and political events run during the festival where human-to-human exchange, expression and interaction created clouds of CO2 in enclosed spaces. The project intended to start a discussion about carbon exchange during the festival; asking about the real carbon costs of an international festival but also asking about the role of critical art practices in imagining different paths through our collective climate future.
Monitoring Sites
The Reference Site
Arthur’s Seat-Edinburgh’s own Mauna Loa and volcanic relic
A Site of Special Scientific Interest for its geology, flora and fauna, Arthur’s Seat reaches 250m (822ft) above sea level and is an iconic feature of Edinburgh where the wind always blows. It has been a continual inspiration for artists up to the present day: last year NVA and the Edinburgh International Festival produced Speed of Light, an event combining walking, light, Arthur’s Seat and the cityscape of Edinburgh. The land was formed by an extinct volcano system 350 million years ago in the Carboniferous period and the surrounding rock was eroded by glaciation in the past two million years, shaping Arthur’s Seat and leaving a tail of material which forms Salisbury Crags. The area is an important site historically as studying it helped James Hutton develop his ideas about the way in which sedimentary rocks (laid down as sediments in water) and igneous rocks (formed through the solidification of magma or lava) are formed. (You can see an area named Hutton’s Section in the Salisbury Crags where magma forced its way through the sedimentary rocks above it.) Perhaps through this project, the site will become as important internationally as the starting point for an increased public understanding of CO2?
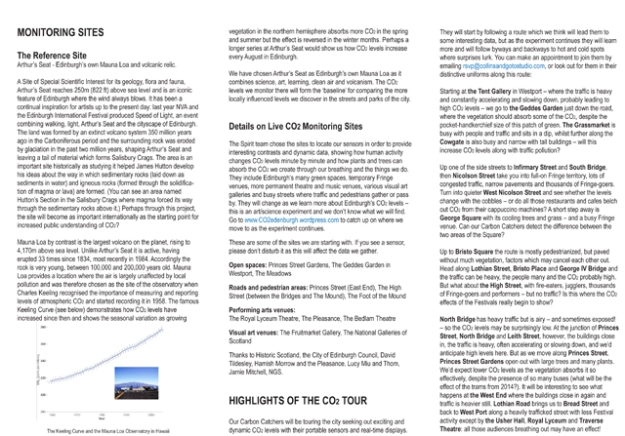
Mauna Loa by contrast is the largest volcano on the planet, rising to 4,170m above sea level. Unlike Arthur’s Seat it is active, having erupted 33 times since 1834, most recently in 1984. Accordingly the rock is very young, between 100,00 and 200,00- years old. Mauna Loa provides a location where the air is largely unaffected by local pollution and was therefore chosen as the site of the observatory when Charles Keeling recognized the importance of measuring and reporting levels of atmospheric CO2 and started recording it in 1958. The famous Keeling Curve (see below) demonstrates how CO2 levels have increased since then and shows the seasonal variation as growing vegetation in the northern hemisphere absorbs more CO2 in the spring and summer but the effect is reversed in the winter months. Perhaps a longer series at Arthur’s Seat would show us how CO2 levels increase every August in Edinburgh.
We chose Arthur’s Seat as Edinburgh’s own Mauna Loa as it combines science, art, learning, clean air and volcanism. The CO2 levels we monitor there will form the ‘baseline’ for comparing more locally influenced levels we discover in the streets and parks of the city.
Details on Live CO2 Monitoring Sites
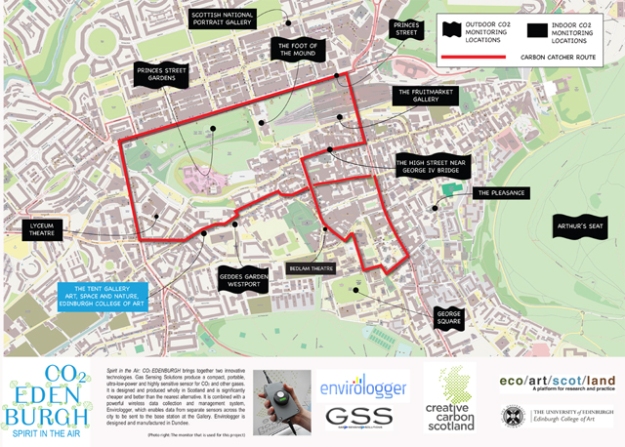
The Spirit team chose the sites to locate our sensors in order to provide interesting contrasts and dynamic data, showing how human activity changes CO2 Levels minute by minute and how plants and trees can absorb the CO2 we create through our breathing and the things we do. They included Edinburgh’s many green spaces, temporary Fringe venues, more permanent theatre and music venues, various visual art galleries and busy streets where traffic and pedestrians gather or pass by. They changed as we learned more about Edinburgh’s CO2 levels—this was an art/science experiment and we did not know what would will find. Go to www.CO2edenburgh.wordpress.com for an overview of the sites, the process and the experiments.
Highlights of the CO2 Tour
Our Carbon Catchers will be touring the city seeking out exciting and dynamic CO2 levels with their portable sensors and real-time displays. They will start by following a route which we think will lead them to some interesting data, but as the experiment continues they will learn more and will follow byways and backways to hot and cold spots where surprises lurk. You can make an appointment to join them by emailing [email protected], or look out for them in their distinctive uniforms along this route:
Starting at the Tent Gallery in Westport—where the traffic is heavy and constantly accelerating and slowing down, probably leading to high CO2 levels—we go to the Geddes Garden just down the road where the vegetation should absorb some of the CO2, despite the pocket-handkerchief size of this patch of green. The Grassmarket is busy with people and traffic and sits in a dip, whilst further along the Cowgate is also busy and narrow with tall buildings— will this increase CO2 levels along with traffic pollution?
Up one of the side streets to Infirmary Street and South Bridge then Nicolson Street take you into full-on Fringe territory, lots of congested traffic, narrow pavements and thousands of Fringe-goers. Turn into quieter West Nicolson Street and see whether the levels change with the cobbles—or do all those restaurants and cafes belch out CO2 from their cappuccino machines? A short step away is George Square with its cooling trees and grass—and a busy Fringe venue. Can our Carbon Catchers detect the difference between the two areas of the Square?
Up to Bristo Square the rout is mostly pedestrianized, but paved without much vegetation, factors which may cancel each other out. Head along Lothian Street, Bristo Place and George IV Bridge and the traffic can be heavy, the people many and the CO2 probably high. But what about the High Street, with fire-eaters, jugglers, thousands of Fringe-goers and performers—but no traffic? Is this where the CO2 effects of the Festivals really begin to show?
North Bridge has heavy traffic but is airy—and sometimes exposed!—so the CO2 levels may be syprisingly low. At the junction of Princes Street, North Bridge and Leith Street, however, the buildings close in, the traffic is heavy, often accelerating or slowing down, and we’d anticipate high levels here. But as we move along Princes Street, Princes Street Gardens open out with large trees and many plants. We’d expect lower CO2 levels as the vegetation absorbs it so effectively, despite the presence of so many buses (what will be the effect of the trams from 2014?). It will be interesting to see what happens at the West End where the buildings close in again and traffic is heavier still. Lothian Road brings us to Bread Street and back to West Port along a heavily trafficked street with less Festival activity except by the Usher Hall, Royal Lyceum and Traverse Theatre: all those audiences breathing out may have an effect!
CO2 Edenburgh Brochure Page 1
CO2 Edenburgh Brochure Page 2
Carbon Catcher Route Map


